No Harbour
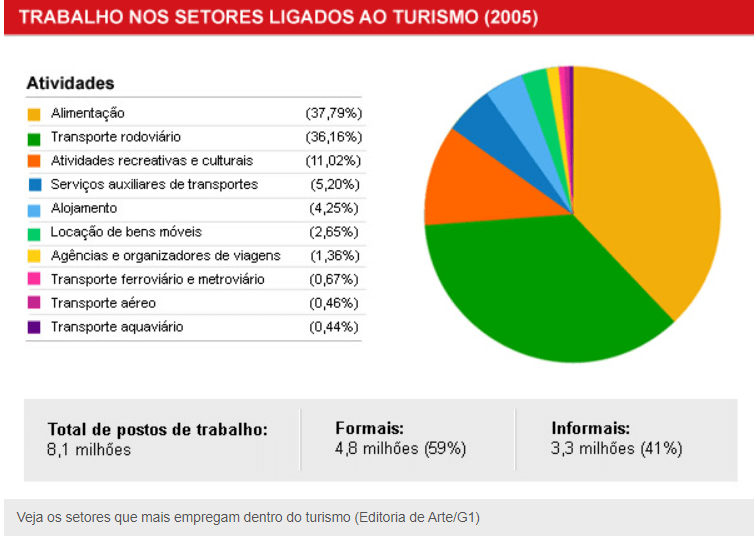
Assim como a foto abaixo
Moderador: Moderadores

Código: Selecionar todos
************************************************************
PROCEDURE GRAFICO_Google( cColunas, cTitulo, cLegenda, cArq)
************************************************************
*
*
LOCAL cHTML, nI, nJ, xVALOR, nHan , cEOL:=hb_eol(), cStdOut, cStdErr
Private cTexto :=  cLegenda //Precisa de ser private para usar & dentro de -> TEXT TO VAR

Text TO VAR cHTML
<!DOCTYPE html>
<html>
<head>
  <script src="https://www.gstatic.com/charts/loader.js"></script>
  <script>
    google.charts.load('current', {packages: ['corechart'], 'language': 'pt-BR'});
    google.charts.setOnLoadCallback(drawChart);

    function drawChart() {
      // Define the chart to be drawn.
      var data = new google.visualization.arrayToDataTable([
      ["Element","Total", { role: "style"}],
       xColunas ])

      var view = new google.visualization.DataView(data);
      view.setColumns([0, 1,
                       { calc: "stringify",
                         sourceColumn: 1,
                         type: "string",
                         role: "annotation" },
                       2]);
      var options = {
        title: "xTitulo" ,
        width: 1300,
        height: 600,
        is3D: true,
        bar: {groupWidth: "95%"},
        legend: { position: "none" },
      };

      // Instantiate and draw the chart.
      var chart = new google.visualization.ColumnChart(document.getElementById('myColumnChart'));
      chart.draw(view, options);
      //chart.draw(data, {width: 1024, height: 640, is3D: true, title: 'xTitulo' });
    }
  </script>
</head>
<body>

&cTexto
<!-- Identify where the chart should be drawn. -->
<div id="myColumnChart"/>

</body>
ENDTEXT
cHTML := StrTran(cHtml,'xColunas',cColunas)
cHTML := StrTran(cHtml,'xTitulo',cTitulo)
cHtml += '</html>'

nHan := FCREATE( cARQ )
FWRITE ( nHan , cHTML , LEN( cHTML ) )
FCLOSE( nHan )

#ifdef __PLATFORM__WINDOWS
   hwg_ShellExecute(cArq,"open",nil,cDirSist,1)
#else
   hb_processRun( 'open ' + cArq,,@cStdOut,@cStdErr,.T. )
#endif

   IF !Empty(cStdOut)
      hwg_msgstop(cStdOut)
   ENDIF
   IF !Empty(cStdErr)
      hwg_msgstop(cStdErr)
   ENDIF
//__RUN( "START EXPLORER " + cArq )
RETURN .T.

FUNCTION printchart
RETURN NIL

FUNCTION grafico
/*----------------------------------------------------------------------*/

*************************************************************
FUNCTION Pie_Chart(cPedacos, cTitulo, cLegenda, cArq, aLinha)
*************************************************************
*
*
LOCAL cHtml, nHan, cLinha := ""
hb_default(@aLinha,{})
Text TO VAR cHTML
<html>
  <head>
    <script type="text/javascript" src="https://www.gstatic.com/charts/loader.js"></script>
    <script type="text/javascript">
      google.charts.load("current", {packages:["corechart"]});
      google.charts.setOnLoadCallback(drawChart);
      function drawChart() {
        var data = google.visualization.arrayToDataTable([
          xPedacos
        ]);

        var options = {
          title: xTitulo,
          is3D: true,
        };

        var chart = new google.visualization.PieChart(document.getElementById('piechart_3d'));
        chart.draw(data, options);
      }
    </script>
  </head>
  <body>
    <div id="piechart_3d" style="width: 1200px; height: 550px;"></div>
     xLinha
  </body>
</html>
ENDTEXT

FOR nL := 1 TO Len(aLinha)
   cLinha += aLinha[nL]
NEXT

cHTML := StrTran(cHtml,'xPedacos',cPedacos)
cHTML := StrTran(cHtml,'xTitulo',cTitulo)
cHtml := StrTran(cHtml,'xLinha',cLinha)

cHtml += '</html>'

//HWG_MSGINFO(cArq)
hb_MemoWrit(cArq,cHtml)
//nHan := FCREATE( cARQ )
//FWRITE ( nHan , cHTML , LEN( cHTML ) )
//FCLOSE( nHan )
//__RUN( "START EXPLORER " + cArq )
hwg_Shellexecute(cArq,"open",,cDirSist,1)
Código: Selecionar todos
/* TEXT TO <varname> */
#xcommand TEXT TO <v> => #pragma __text|<v>+=%s+hb_eol();<v>:=""